You can’t control what you can’t measure, right? In order to make decisions about your print infrastructure, you need accurate data. We call this making data driven decisions and it is what our YSoft SafeQ Reporting module delivers.
Which printers are being utilized the most, which are underutilized? Which departments are printing the most, which users are the heaviest print users?
YSoft SafeQ provides IT administrators a variety of report options that can answer these and many other questions. From using pre-defined report templates that can be automatically generated and delivered, to a variety of filters and settings for creating personalized reports, the Reporting module offers insights based on factual usage inside your organization.
Visualizing and Scenario Modeling – Integration with NewField IT
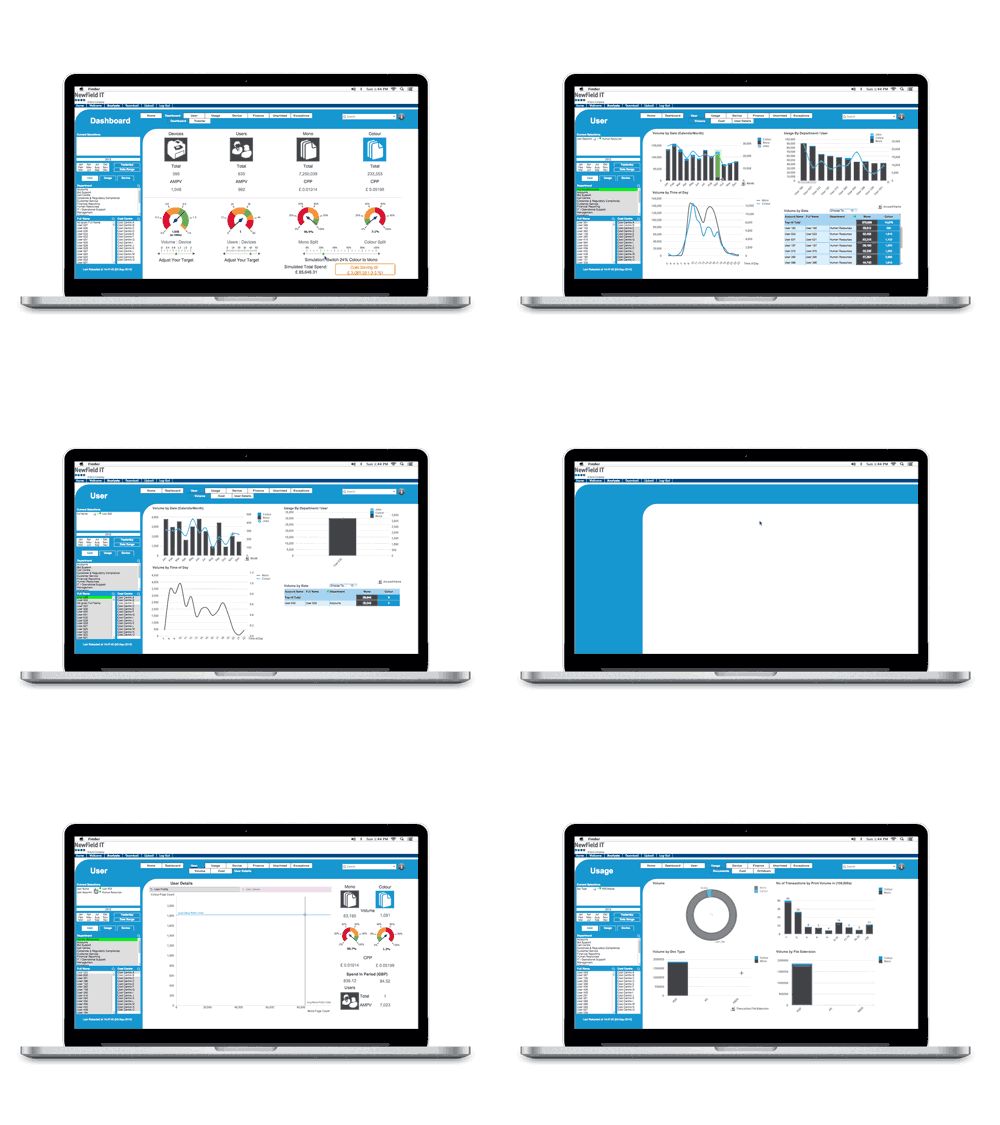
More and more, organizations are utilizing business intelligence systems to further analyze data. For example, NewField IT’s CompleteView User Analytics Tool can take YSoft SafeQ reporting data to visualize and analyze usage and model scenarios to identify cost saving and improvement opportunities.
CompleteView User Analytics easily integrates with YSoft SafeQ (version 5)[1]; the administrator only needs to configure CompleteView User Analytics to point to the YSoft SafeQ server. CompleteView User Analytics will extract YSoft SafeQ’s prepared data directly from the database and place it into CompleteView User Analytics’ dashboard where it can be visually presented, segmented and drilled down for precise and accurate analysis in real time. And since YSoft SafeQ works across multiple brands and models of multifunction devices, CompleteView User Analytics will analyze data from print jobs on all your devices even if you have a mixed brand fleet.


