CORRECTION – This page had previously stated that revenue was up 34%. I Apologize for the error, the correct number is 4.7%.
(1) Qualitative Information on the Consolidated Business Performance
a. Overview of Performance
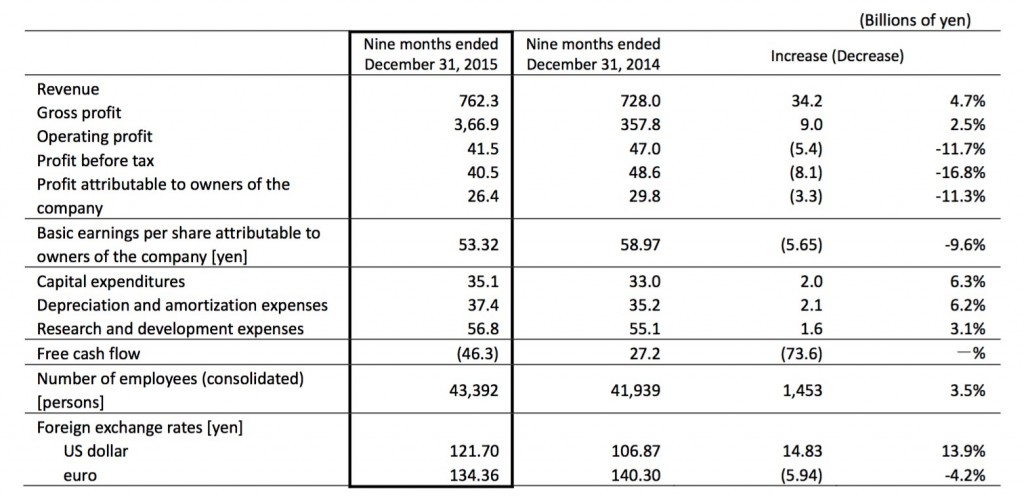
In the nine months ended December 31, 2015 (hereafter, “period under review”), consolidated revenue of the Konica Minolta Group (hereafter, “the Group”) amounted to ¥762.3 billion, an increase of 4.7% year on year. By business segment, in the Business Technologies Business sales of high‐end color models for office and commercial printing rose, while corporate acquisitions and the effects of the weaker yen against the US dollar made a contribution to continued revenue growth. In the Industrial Business, sales of optical systems for industrial use remained roughly at previous‐year levels, but the field of performance materials posted lower revenue due to lower sales volumes. In the Healthcare Business, sales were strong both in Japan and overseas which, together with corporate acquisitions in the US, led to higher revenue.
Operating profit was ¥41.5 billion, falling by 11.7% over the same period in the previous year. The Business Technologies Business posted only a small increase in profit as it was significantly affected by the yen strengthening against the euro, a trend that became pronounced in the latter half of the period under review and that has a considerable impact on profits. Also, while the tone of rising profits in the Healthcare Business became increasingly clear, falling sales in the Industrial Business led to lower profits. The overall decline in profit in the business divisions coincided with costs related to structural reforms implemented in the first half of the period under review, causing a fall in profit for the Group as a whole.
Customer cuts print costs 20% with Konica Minolta and Y Soft
Profit before tax came to ¥40.5 billion (down 16.8% year on year) and profit attributable to the owners of the company was ¥26.4 billion (down 11.3% year on year).
<Progress report on the Medium Term Business Plan “TRANSFORM 2016”>
In line with the TRANSFORM 2016 Medium Term Business Plan, the Group is driving ahead with measures aimed at transforming itself into a customer‐centric group of companies and at realizing sustainable profit growth. During the period under review, we developed “Care Support Solution” to resolve social problems such as the progressive ageing of societies in Japan and Asia leading to a rise in the number of people requiring nursing care, as well as shortages of caregiving staff. We are also ramping up activities aimed at the commercialization of wide‐angle laser radar, the development of which was announced by Konica Minolta in January 2015, which could be used in advanced security systems and is now undergoing application development and demonstration testing.
At the Business Innovation Centers (BIC) established in five major regions around the world, initiatives to create new businesses in coordination with a diverse range of entities such as academic institutes, research institutes, and start‐ups in each region are progressing steadily and we expect contributions to business to begin in earnest in FY2017 and FY2018.
For an overview of BIC, please see the Konica Minolta website: http://www.konicaminolta.com/about/releases/2014/0210_01_01.html
i. Business Technologies Business
<Office Services>
For mainstay A3 color MFPs (Multi‐functional peripherals), price competition is intensifying in the US and European markets. The Group has followed a marketing strategy of maintaining prices and has succeeded in growing sales of high‐value‐ added products, primarily mid‐range and higher‐segment models. Sales of monochrome models as well were strong in Europe and China, and sales volumes exceeded prior‐year levels.
Regarding major negotiations with large companies for global purchasing, sales are expanding steadily due to new large‐ scale contract wins (such as with a major European general construction company) and contract renewals at existing customers. In “hybrid‐type sales,” which combine equipment sales with the provision of IT services, the Group proposed a solution for improving the efficiency of document management and workflow to a leading US educational institution. This proposal won the large‐scale contract, showing that “non‐price competition” based on more than just pricing factors is taking root.
<Commercial and industrial printing>
In production print, sales of the top‐of‐the‐line “bizhub PRESS C1100” digital color printing system grew primarily in the US and Europe, which further strengthened the foundation for an expansion in color print volumes.
In Marketing Print Management (MPM) services, which help optimize printing costs and improve business processes in a company’s marketing department, the Group won new customers. In addition, we expanded the scope of services provided to an existing customer, from the traditional production of printed materials to digital content management. In the industrial inkjet business, sales of components such as inkjet printheads for use in large‐format printers were strong.
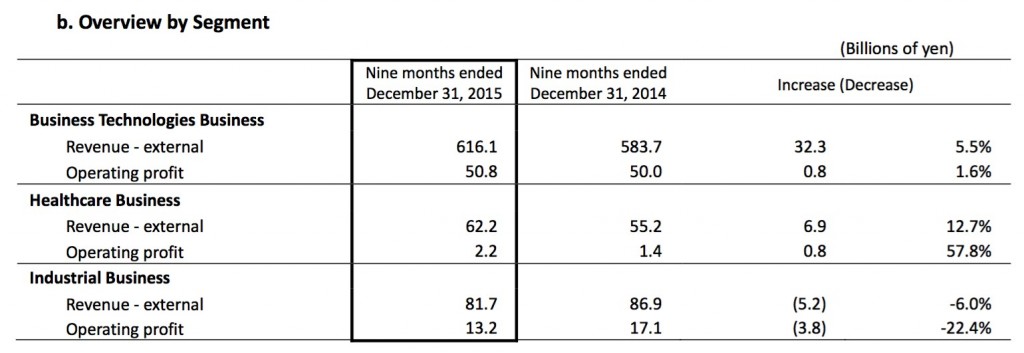
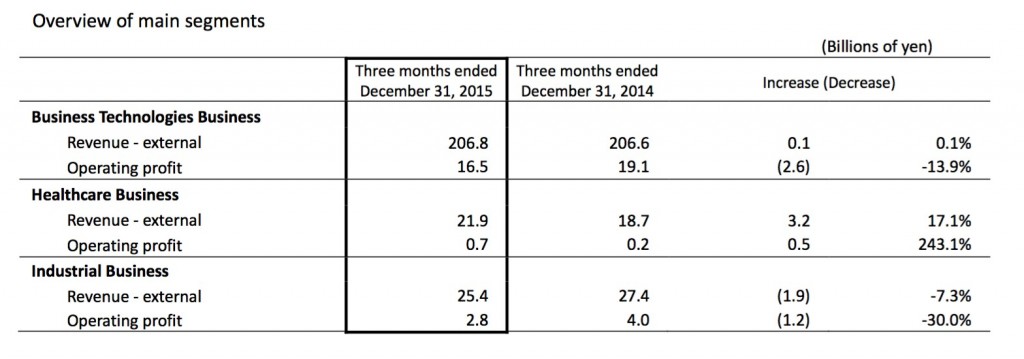
As a result, revenue of the Business Technologies Business from external customers stood at ¥616.1 billion, up 5.5% year on year, and operating profit was ¥50.8 billion, up 1.6% year on year. Revenues rose due to the effect of acquisitions and the weaker yen against the US dollar. Despite gains on sale of property, plant and equipment in North America, in addition to the yen continuing the previous year’s trend of strengthening against the euro, which has a significant impact on profits, there were also increases in costs related to the transformation in the focus of our business, including the bolstering of our service provision capability, and thus only a small increase in profit was achieved.
ii. Healthcare Business
During the period under review, sales of picture archiving and communication systems (PACS) and diagnostic ultrasound systems grew significantly in Japan. “AeroDR” cassette‐type digital X‐ray diagnostic imaging systems grew steadily, primarily in overseas markets. By region, in Japan the SONIMAGE HS1 diagnostic ultrasound system has been widely recognized for its diagnostic performance in the field of orthopedic surgery and revenue was boosted by rising sales. Overseas, sales in the US, where Viztek was acquired in October 2015, contributed to an increase in revenue.
As a result, revenue of the Healthcare Business from external customers stood at ¥62.2 billion, up 12.7% year on year, and operating profit was ¥2.2 billion, up 57.8% year on year. In addition to the increase in gross profit generated by rising sales of mainstay products, there was a rise in the number of service contracts, which depend on the installed base of such products and equipment, which in turn contributed to an improvement in profitability.
In the primary care market, where further growth is expected, the Group will leverage its synergies with Viztek, which has superior solutions proposal and development capabilities, and is working to strengthen its provision of global medical IT solution services.
iii. Industrial Business
<Performance materials>
Sales of TAC film for large LCD televisions, which had been solid despite difficult overall market conditions, slowed in the latter half of the period under review due to the impact of falling demand in emerging markets. Conversely, for small and medium‐size panels, the thin‐film products in which the Group specializes turned to recovery in the latter half of the period under review.
<Optical systems for industrial use>
In measuring instruments, higher revenue was achieved due in part to the acquisition of Radiant. In lenses for industrial and professional use, sales of optical units for projectors were strong.
As a result, revenue of the Industrial Business from external customers came to ¥81.7 billion (down 6.0% year on year) and operating profit stood at ¥13.2 billion (down 22.4% year on year).
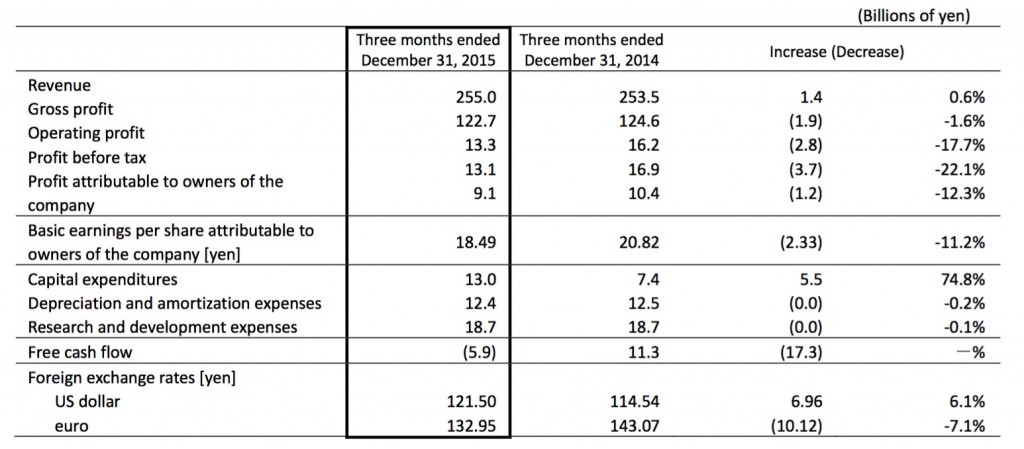
(Reference) Overview of 3Q consolidated accounting period
(2) Qualitative Information on the Consolidated Financial Position
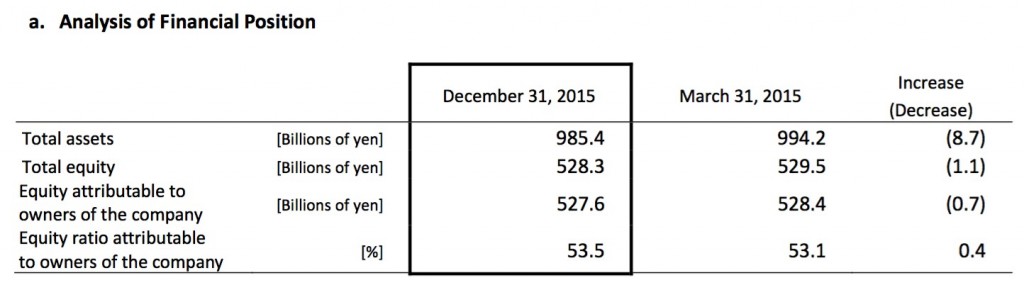
Total assets at December 31, 2015 were down ¥8.7 billion (0.9%) from the previous fiscal year‐end, to ¥985.4 billion. Total current assets decreased ¥49.5 billion (8.7%) to ¥521.0 billion (52.9% to total assets) and total non‐current assets increased ¥40.7 billion (9.6%) to ¥464.3 billion (47.1% to total assets). With respect to current assets, cash and cash equivalents decreased ¥67.3 billion to ¥110.1 billion, and trade and other receivables decreased ¥8.2 billion to ¥244.7 billion, while inventories increased ¥22.6 billion to ¥143.4 billion. With respect to non‐current assets, property, plant and equipment decreased ¥0.3 billion to ¥181.2 billion as a result of overall ongoing depreciation despite an increase due primarily to capital expenditures in the Business Technologies Business. Goodwill and intangible assets increased ¥44.4 billion to ¥170.6 billion, mainly due to acquisition.
Total liabilities at December 31, 2015 were ¥457.0 billion, a decrease of ¥7.6 billion (1.6%) from the previous fiscal year‐ end. Trade and other payables decreased by ¥3.3 billion to ¥174.2 billion, while income tax payables fell ¥3.3 billion to ¥4.1 billion. Conversely, bonds and borrowings (the sum of amounts posted as current liabilities and non‐current liabilities) amounted to ¥169.1 billion, an increase of ¥3.5 billion in total despite redemption of bonds of ¥20.0 billion. Retirement benefit liabilities increased by ¥1.3 billion to ¥63.4 billion.
Total equity at December 31, 2015 amounted to ¥528.3 billion, a decrease of ¥1.1 billion from the previous fiscal year‐end. Retained earnings increased ¥2.9 billion to ¥254.2 billion. This was mainly the result of an increase due to profit attributable to owners of the company of ¥26.4 billion and a decrease due to cash dividends of ¥12.4 billion and cancellation of the treasury shares of ¥11.0 billion. Treasury shares decreased ¥1.2 billion to negative ¥9.5 billion as a result of acquisition of the Company’s own shares of ¥9.9 billion and cancellation of the treasury shares of ¥11.0 billion based on the resolutions at the Board of Directors meeting. Other components of equity at December 31, 2015 totaled ¥41.0 billion, a decrease of ¥4.8 billion, due to a loss on exchange differences on translation of foreign operations of ¥4.2 billion and a net loss on revaluation of financial assets measured at fair value of ¥0.9 billion.
Equity attributable to owners of the company totaled ¥527.6 billion at December 31, 2015, a decrease of ¥0.7 billion from the previous fiscal year‐end, and the equity ratio attributable to owners of the company increased 0.4 percentage points to 53.5%.
b. Cash Flows
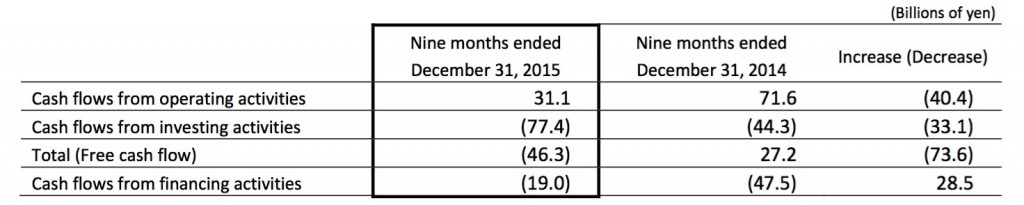
During the nine months ended December 31, 2015 (hereafter, “period under review”), net cash provided by operating activities was ¥31.1 billion, while net cash used in investing activities, mainly associated with capital expenditures and M&As, totaled ¥77.4 billion. As a result, free cash flow (the sum of operating and investing activities) was an outflow of ¥46.3 billion.
Net cash used in financing activities was ¥19.0 billion.
In addition, cash and cash equivalents at December 31, 2015 decreased ¥60.3 billion from the previous fiscal year‐end to ¥110.1 billion, reflecting the unfavorable effect of exchange rate changes on cash and cash equivalents of ¥1.9 billion.
The details of cash flows associated with each activity during the period under review are as follows.
Cash flows from operating activities
Net cash provided by operating activities for the period under review was ¥31.1 billion, compared to net cash provided of ¥71.6 billion in the same period of the previous fiscal year, as a result of cash inflow due to profit before tax of ¥40.5 billion, depreciation and amortization expenses of ¥37.4 billion, and a decrease in trade and other receivables of ¥8.2 billion; and cash outflow due to an increase in inventories of ¥22.4 billion, income taxes paid of ¥13.5 billion, and a decrease in trade and other payables of ¥3.2 billion.
Cash flows from investing activities
Purchases of property, plant and equipment and intangible assets amounted to ¥26.4 billion and ¥9.2 billion, respectively, mainly attributable to capital expenditures in the Business Technologies Business. On the other hand, proceeds from sales of property, plant and equipment amounted to ¥8.6 billion, mainly due to sales of assets in North America. As a result of the acquisition of Radiant in the Industrial Business, and of Viztek in the Healthcare Business, as well as acquisitions in the Business Technologies Business, purchase of investments in subsidiaries of ¥45.1 billion and payments for transfer of business of ¥3.1 billion were recorded. Accordingly, net cash flows used in investing activities came to ¥77.4 billion compared to net cash used in the same period of the previous year of ¥44.3 billion.
As a result, free cash flow (the sum of operating and investing activities) was an outflow of ¥46.3 billion (an inflow of ¥27.2 billion in the same period of the previous fiscal year).
Cash flows from financing activities
There was a ¥29.8 billion increase in short‐term loans payable, redemption of bonds and repayments of long‐term loans payable of ¥26.8 billion, cash dividends paid of ¥12.2 billion, and purchase of treasury shares of ¥10 billion, leading to net cash used in financing activities of ¥19.0 billion compared to net cash used in the same period of the previous year of ¥47.5 billion.
(3) Qualitative Information on the Consolidated Results Forecast
Although we expect the outlook of the business environment that surrounds the Group both in Japan and overseas to remain uncertain, at this point we have not changed the results forecasts announced on October 29, 2015. In the fourth quarter, despite the tough market conditions, each of our businesses will work to enhance our earning capacity by expanding sales of mainstay products and promoting sales of high‐value‐added products.
Moreover, the exchange rate assumptions that form the basis for the forecasts are also unchanged from the figures announced on October 29, 2015 (US$: ¥120; euro: ¥135).
These results forecasts are based on future‐related suppositions, outlooks and plans at the time this report was released, and they involve risks and uncertainties. It should be noted that actual results may differ significantly from these forecasts due to various important factors, such as changes in economic conditions, market trends and currency exchange rates.
Figures in qualitative information sections given as billions of yen have been rounded off to the nearest hundred million yen.