Highlights
- FY14 revenue stabilized, at $111.5 billion, flat in constant currency or down 1% YoY as reported
- Profitability improved due to the operational improvements we’ve made through the year and FY14 non-GAAP EPS grew 5% YoY to $3.74, at the high end of our previously provided outlook of $3.70 to $3.74 per share
- FY14 GAAP EPS came in at $2.62, within the previously provided outlook of $2.60 to $2.64 per share
Q4
- Q4 revenue was as expected, while two major deals in the fourth quarter of last year (UP and a hyperscale deal) that made for tough compares.
- Q4 revenue was $28.4 billion, down 2% from the prior-year period and down 3% on a constant currency basis
- Q4 profitability was strong, with OP improvement across each of our business segments. Non-GAAP EPS was $1.06, up 5% from the prior-year period, at the high end of our previously provided outlook of $1.03 to $1.07 per share
- Q4 GAAP EPS was $0.70, down 4% from the prior-year period, at the high end of our previously provided outlook of $0.67 to $0.71 per share
Outlook
- For FY15, we reaffirm our non-GAAP EPS estimate of $3.83 to $4.03 and GAAP diluted net EPS estimate of $3.23 to $3.43.
- For Q1 FY15, we estimate non-GAAP EPS to be in the range of $0.89 to $0.93 and GAAP EPS to be in the range of $0.72 to $0.76.
- Our GAAP estimates for Q1 and FY15 do NOT include separation related costs. We will provide an update on those costs on the Q1 call.
PALO ALTO, Calif., Nov. 25, 2014 — HP today announced financial results for fiscal 2014 and fourth quarter ended October 31, 2014.
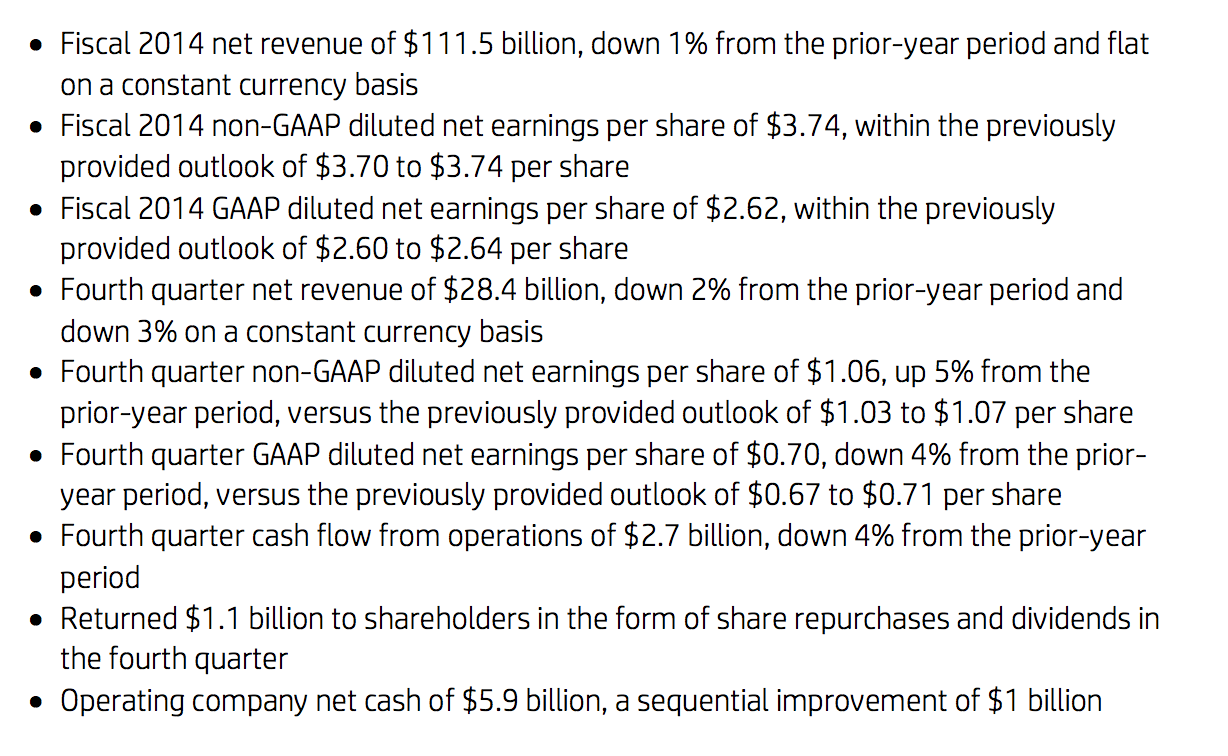
Fiscal 2014 net revenue of $111.5 billion was down 1% from the prior-year period and flat on a constant currency basis.
Fiscal 2014 GAAP diluted net earnings per share (EPS) was $2.62, flat in comparison with the prior-year period amount and within the previously provided outlook of $2.60 to $2.64 per share. Fiscal 2014 non-GAAP diluted net EPS was $3.74, up from $3.56 in the prior-year period and within the previously provided outlook of $3.70 to $3.74 per share. Fiscal 2014 non-GAAP net earnings and non-GAAP diluted net EPS exclude after-tax costs of $2.1 billion and $1.12 per diluted share, respectively, related to restructuring charges, the amortization of intangible assets and acquisition-related charges.
Fourth quarter net revenue of $28.4 billion was down 2% from the prior-year period and down 3% on a constant currency basis.
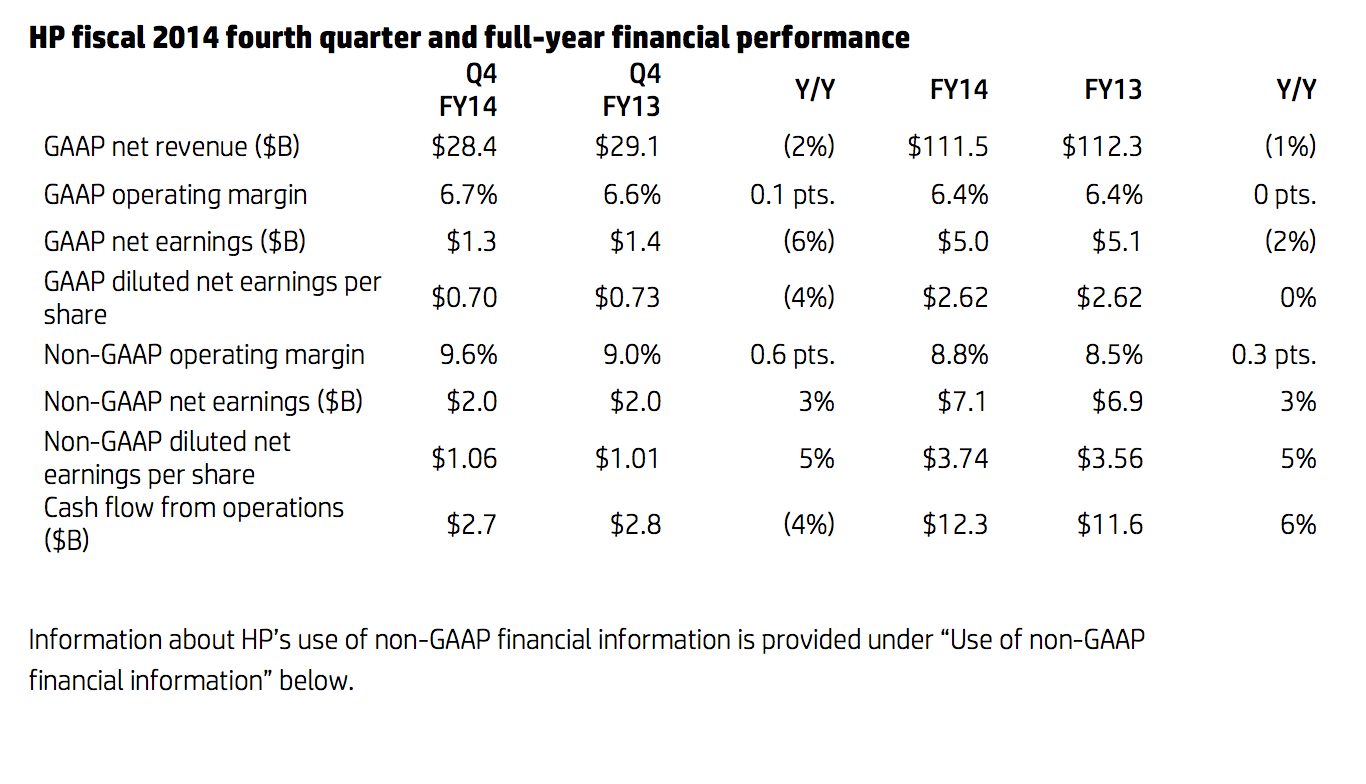
Fourth quarter diluted net GAAP EPS was $0.70, down from $0.73 in the prior-year period and within its previously provided outlook of $0.67 to $0.71 per share. Fourth quarter non-GAAP diluted net EPS was $1.06, up from $1.01 in the prior-year period and within its previously provided outlook of $1.03 to $1.07. Fourth quarter non-GAAP net earnings and non-GAAP diluted net EPS exclude after-tax costs of $684 million and $0.36 per diluted share, respectively, related to restructuring charges, the amortization of intangible assets and acquisition-related charges.
“I’m excited to say that HP’s turnaround continues on track,” said Meg Whitman, chairman, president and chief executive officer, HP. “In FY14, we stabilized our revenue trajectory, strengthened our operations, showed strong financial discipline, and once again made innovation the cornerstone of our company. Our product roadmaps are the best they’ve been in years and our partners and customers believe in us. There’s still a lot left to do, but our efforts to date, combined with the separation we announced in October, sets the stage for accelerated progress in FY15 and beyond.”
Outlook
For fiscal 2015, HP estimates non-GAAP diluted net EPS to be in the range of $3.83 to $4.03 and GAAP diluted net EPS to be in the range of $3.23 to $3.43. Fiscal 2015 non- GAAP diluted net EPS estimates exclude after-tax costs of approximately $0.60 per share, related primarily to the amortization of intangible assets and restructuring charges.
Other interesting articles
- Xerox Acquires Seattle Solutions Company
- Introducing Xerox Digital Alternatives
- How to Sign a PDF Document with Xerox Digital Alternatives
For the fiscal 2015 first quarter, HP estimates non-GAAP diluted net EPS to be in the range of $0.89 to $0.93 and GAAP diluted net EPS to be in the range of $0.72 to $0.76. Fiscal 2015 first quarter non-GAAP diluted net EPS estimates exclude after-tax costs of approximately $0.17 per share, related primarily to the amortization of intangible assets and restructuring charges.
The fiscal 2015 full year and first quarter outlooks do not include costs associated with the separation, which are expected to be non-GAAP adjustments beginning in Q1 2015.
Asset management
HP generated $2.7 billion in cash flow from operations in the fourth quarter, down 4% from the prior-year period. Inventory ended the quarter at $6.4 billion, up 3 days year over year to 27 days. Accounts receivable ended the quarter at $13.8 billion, down 5 days year over year to 44 days. Accounts payable ended the quarter at $15.9 billion, up 11 days year over year to 67 days. HP’s dividend payment of $0.16 per share in the fourth quarter resulted in cash usage of $309 million. HP also utilized $750 million of cash during the quarter to repurchase approximately 21.7 million shares of common stock in the open market. HP exited the quarter with $15.5 billion in gross cash.
Fiscal 2014 fourth quarter segment results
- Personal Systems revenue was up 4% year over year with a 4.0% operating margin. Commercial revenue increased 7% and Consumer revenue decreased 2%. Total units were up 5% with Desktops units down 2% and Notebooks units up 8%.
- Printing revenue was down 5% year over year with an 18.1% operating margin. Total hardware units were down 1% with Commercial hardware units up 5% and Consumer hardware units down 4%. Supplies revenue was down 7%.
- Enterprise Group revenue was down 4% year over year with a 14.8% operating margin. Industry Standard Servers revenue was down 2%, Storage revenue was down 8%, Business Critical Systems revenue was down 29%, Networking revenue was up 2% and Technology Services revenue was down 3%.
- Enterprise Services revenue was down 7% year over year with a 6.8% operating margin. Application and Business Services revenue was down 6% and Infrastructure Technology Outsourcing revenue declined 7%.
- Software revenue was down 1% year over year with a 31.1% operating margin. License revenue was up 2%, support revenue was down 1%, professional services revenue was down 5% and software-as-a-service (SaaS) revenue was flat.
- HP Financial Services revenue was down 1% year over year with a 1% decrease in net portfolio assets and a 15% increase in financing volume. The business delivered an operating margin of 12.1%.More information on HP’s earnings, including additional financial analysis and an earnings overview presentation, is available on HP’s Investor Relations website at www.hp.com/investor/home.
HP’s Q4 FY14 earnings conference call is accessible via an audio webcast at www.hp.com/investor/2014Q4webcast.
About HP
HP creates new possibilities for technology to have a meaningful impact on people, businesses, governments and society. With the broadest technology portfolio spanning printing, personal systems, software, services and IT infrastructure, HP delivers solutions
for customers’ most complex challenges in every region of the world. More information about HP (NYSE: HPQ) is available at http://www.hp.com.
Use of non-GAAP financial information
To supplement HP’s consolidated condensed financial statements presented on a generally accepted accounting principles (GAAP) basis, HP provides revenue on a constant currency basis, non-GAAP operating profit, non-GAAP operating margin, non-GAAP net earnings, non-GAAP diluted net earnings per share, gross cash, free cash flow, net capital expenditures, net debt, net cash, operating company net debt and operating company net cash. HP also provides forecasts of non-GAAP diluted net earnings per share. A reconciliation of the adjustments to GAAP results for this quarter and full year and prior periods is included in the tables below or elsewhere in the materials accompanying this news release. In addition, an explanation of the ways in which HP’s management uses these non-GAAP measures to evaluate its business, the substance behind HP’s decision to use these non-GAAP measures, the material limitations associated with the use of these non-GAAP measures, the manner in which HP’s management compensates for those limitations, and the substantive reasons why HP’s management believes that these non-GAAP measures provide useful information to investors is included under “Use of non-GAAP financial measures” after the tables below. This additional non-GAAP financial information is not meant to be considered in isolation or as a substitute for revenue, operating profit, operating margin, net earnings, diluted net earnings per share, cash and cash equivalents, cash flow from operations, capital expenditures, or total company debt prepared in accordance with GAAP.